Slicers – what are they?
Slicers are visual filters. Using a slicer, you can filter your data (or pivot table, pivot chart) by clicking on the type of data you want.
For example, let's say you are looking at sales by customer profession in a pivot report. And you want to see how the sales are for a particular region. There are 2 options for you do drill down to an individual region level.
- Add region as report filter and filter for the region you want.
- Add a slicer on region and click on the region you want.
With a report filter (or any other filter), you will have to click several times to pick one store. With slicers, it is a matter of simple click.
See this demo:
Download Slicer Examples Workbook
This post is very long and has many examples. Please click here to download slicer examples demo workbook. It contains all the examples shown in this post and a fun surprise too.
How to insert a slicer?
Note: Slicers are available only in Excel 2010 and above.
Adding a slicer in Excel 2010:
In Excel 2010, you can add a slicer only to pivot tables. To insert a slicer, go to either,
- Insert ribbon and click on Insert Slicer
- or Options ribbon (PivotTable Tools) and click on Insert Slicer
Adding a slicer in Excel 2013 / 2016:
In Excel 2013 and above, you can add a slicer to either pivot tables or regular tables.
Adding slicers to regular tables:
When you add a slicer to regular Excel tables, they just act like auto-filters and filter your table data. To add a slicer to regular table, use Insert ribbon > Insert Slicer button.
Adding slicers to Pivot tables:
To add a slicer, you can do either of these things:
- Right click on pivot table field you want and choose "add as slicer"

- Use either analyze or insert ribbon to add the slicer.

Single vs. Multi-selection in Slicers
You can select a single item or multiple items in slicers. To multi-select,
- If the items you want are together, just drag from first item to last.
- If the items you want are not together, hold CTRL key and click on one at a time.
Creating interactive charts with slicers
Since slicers talk to Pivot tables, you can use them to create cool interactive charts in Excel. The basic process is like this:
- Set up a pivot table that gives you the data for your chart.
- Add slicer for interaction on any field (say slicer on customer's region)
- Create a pivot chart (or even regular chart) from the pivot table data.
- Move slicer next to the chart and format everything to your taste.
- And your interactive chart is ready!
Demo of interactive chart using slicer:
Here is a quick demo.
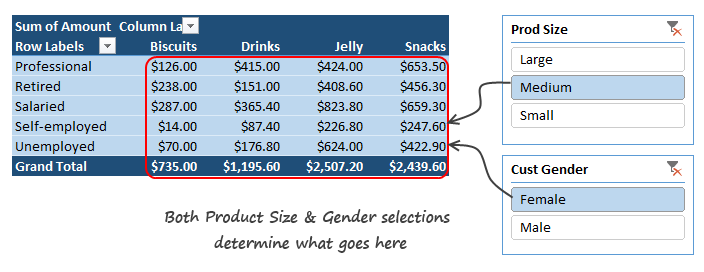
Linking multiple slicers to same Pivot report
You can add any number of slicers to a pivot report. When you add multiple slicers, each of them plays a role in telling the pivot table what sub-set of data to use for calculating the numbers.
Linking one slicer to multiple pivot tables
You can also link a single slicer to any number of pivot reports. This allows us to build very powerful, cross-filtered & interactive reports using Excel.
To connect multiple pivot tables to single slicer, follow these steps.
- Optional: Give names to each of the pivot tables. To name the pivot tables, click anywhere in the pivot, go to Analyze ribbon and use the pivot table name field on top-left to give it a name.
- If you don't name your pivot tables, Excel will give them default names like PivotTable73. This can be confusing once you have more than a few pivot tables.
- Right click on the slicer and go to Report Connections (in Excel 2010, this is called as PivotTable connections).

- Check all the pivot tables you want. Click ok.

Now both pivot tables will respond to the slicer. See this demo:
Linking slicers to more than one chart
You can use the same approach to link one slicer to more than one chart (pivot chart or regular one).
See this demo:
You can examine this chart in detail in the Slicer Examples workbook.
Capturing slicer selection using formulas
While slicers are amazing & fun, often you may want to use them outside pivot table framework. For example, you may want to use slicers to add interactivity to your charts or use them in your dashboard.
When you want to do something like that, you essentially want the slicers to talk to your formulas. To do this, we can use 2 approaches.
- Dummy (or harvester) pivot table route
- CUBE formulas route
Dummy pivot table route
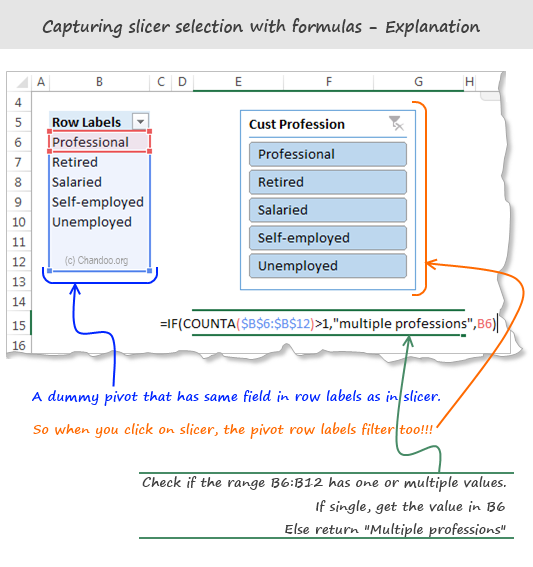
This is the easiest way to capture slicer selection into a cell. Using a dummy pivot table, we can find out which items are selected in slicers and use them for some other purpose, like below:
The process is like this:
- Let's say you want to know which profession is picked up in the slicer (so that you can use it in some formulas or charts).
- Create another pivot table.
- Add the profession field to row labels area.
- Link the slicer to this new pivot table as well (using report connections feature of slicer)
- Now when you click on the slicer, both original pivot and this new dummy pivot change.
- Access row labels like regular cells in your formulas to find out which slicer item is selected.
See this illustration to understand how to set up the formulas:
You received this message because you are subscribed to the Google Groups "Keep_Mailing" group.
To unsubscribe from this group and stop receiving emails from it, send an email to keep_mailing+unsubscribe@googlegroups.com.
To post to this group, send email to keep_mailing@googlegroups.com.
Visit this group at https://groups.google.com/group/keep_mailing.
To view this discussion on the web visit https://groups.google.com/d/msgid/keep_mailing/CAG%3DbiTtPMYs1uYKBCt9W1V_Xgh-fm-M%2Br3_LJuTmTdojhj5dUA%40mail.gmail.com.
For more options, visit https://groups.google.com/d/optout.
No comments:
Post a Comment